Antistatic, static electricity, dust and particle problems
Main menu:
Decay Time
Products > Measuring_list
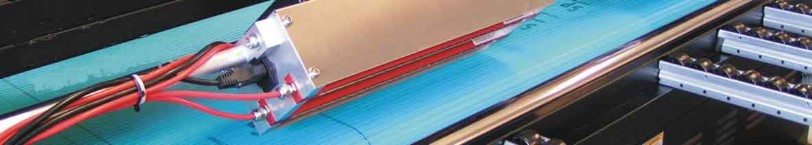
Charge Decay Time Analyser
The decay time for delibrated charged materials is measured with a charge decay time meter JCI155. This measurement provides a direct image of a process so that it looks like in an actual production situation. A material sample is charged under controlled conditions and the decay time and the current decay time curve is recorded, while one can measure the amount of charge-received, relative capacitance and peak charging value of the sample. Thus, for assessing the electrostatic properties of a variety of materials as:
- Paper & package
- Foils, films & plastics
- Additives & coatings
- Substrates
- Clothing
- etc
For further information see link jci Chilworth
We are general agents for jci Chilworth in Denmark,
Norway and Sweden.
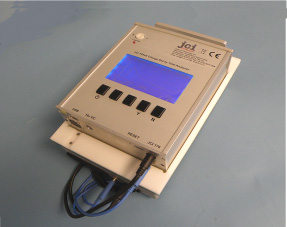
JCI155v6
One example on charge decay time for different paper qualities
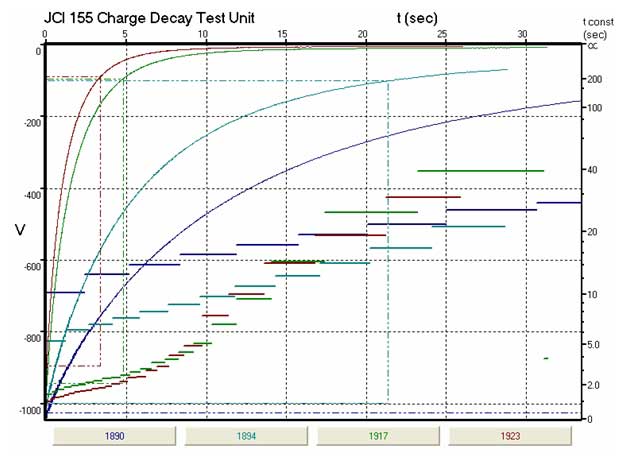
Sample 1890: dry/ front page
Corona (Voltage): -5000
Corona (Time): 0,0401
Surface (Temp. °C): 28,05
Surface (% R.H.): 20
Pretest (Voltage): -93
Peak at -1043,8 volts
Analysis start 0,1 secs after
charging at -1025 volts
1/e reached after 13,65 sec
10% not reached
Received charge = -2,2833 nC
Capacitance loading = 0,939335
Sample 1894: dry/ back side
Corona (Voltage): -5000
Corona (Time): 0,0401
Surface (Temp. °C): 28,25
Surface (% R.H.): 21,16
Pretest (Voltage): -350,86
Peak at -1016,4 volts
Analysis start 0,1 secs after charging
at -999,19 volts
1/e reached after 6,6344 sec
10% reached after 21,337 sec
Received charge = -2,02176 nC
Capacitance loading = 0,854175
Sample 1917: humidly/front page
Corona (Voltage): -5000
Corona (Time): 0,0382
Surface (Temp. °C): 21,46
Surface (% R.H.): 28,22
Pretest (Voltage): -5,29
Peak at -1000,2 volts
Analysis start 0,1 secs after charging
at -943,92 volts
1/e reached after 1,7125 sec
10% reached after 4,775 sec
Received charge = -2,8557 nC
Capacitance loading = 1,22606
Sample 1923: humidly/ back side
Corona (Voltage): -5000
Corona (Time): 0,0382
Surface (Temp. °C): 22,1
Surface (% R.H.): 28,73
Pretest (Voltage): -33,2
Peak at -965,63 volts
Analysis start 0,1 secs after charging
at -893,75 volts
1/e reached after 1,2203 sec
10% reached after 3,3531 sec
Received charge = -3,28181 nC
Capacitance loading = 1,45941